
Position trading involves holding trades for weeks, months, or even years. Position trading is another form of investing. People hold their positions long-term with the expectation that they will become profitable.

Some consider position trading to be a buy-and-hold strategy and not active trading. However, position trading, when done by an advanced trader, can be a form of active trading. Position trading uses long-term charts – anywhere from daily to monthly – in combination with other methods to determine the trend of the current market direction. This type of trade may last for several days to several weeks and sometimes longer, depending on the trend. Position traders ignore short-term price movements in favor of pinpointing and profiting from longer-term trends. It is this type of trading that most closely resembles investing, with the crucial difference being that buy-and-hold investors are limited to only going long.
Even though a position trade may be held for a long period of time, it requires three elements to be successful: a planned entry, a planned exit, and controlled risk.
The basic strategy is to buy when the price crosses above a 40-week (or 200-day) moving average from below. Hold the position until a weekly price bar closes below the 40-week moving average. When the trade is initially placed, a stop loss is used to cap the amount that is lost should it immediately move in an unfavorable direction. Where this is placed depends on the volatility of the asset and the time frame of the trader. Setting a stop loss 5% below the moving average will serve to protect capital but still allow for upside potential
The main risk of position trading is that minor fluctuations, which are commonly ignored, can turn into a full trend reversal and result in a significant loss or drawdown if the trader fails to monitor the position or puts safeguards in place to protect their capital (such as a stop-loss or trailing stop). While this is a danger it also works in the trader’s favor, as the position will also accumulate profit while they’re not looking.
50-Day Moving Average Trading
The 50-day moving average (MA) indicator is a significant technical indicator amongst position traders.
The reason for this is due to the fact that 50 is both a factor of 100 and 200, which have corresponding moving averages that illustrate significant long-term trends. This means that when the 50-day MA intersects with 100- and 200-day MA indicators, it could be indicating the beginning of a new long-term trend – making it an ideal indicator for the position trader.
Support and Resistance Trading
Support and resistance levels can signal where an asset’s price movement is headed, consequently indicating to position traders whether to open or close a position on particular assets.

A support level is a price an asset that, historically, does not fall below. You can have short-term support levels as well as historical support levels that hold for years. Opposingly, the resistance level is the price of security where it historically tends not to be able to break. Position traders will use long term resistance, for instance, to close out positions, only for the security to fall after reaching this point. Similarly, they may buy in at historical support levels if they expect a long term trend to commence at this point.
Trading Breakouts
Trading breakouts can be useful for position traders as they can signal the start of the next major move in the market. Traders employing this technique are attempting to open a position in the early stages of a trend.
A breakout is where the price of an asset moves outside defined support or resistance levels with increased volume. The idea behind trading breakouts is to open a long position after the security breaks above resistance or open a short position when the security breaks below support. A breakout strategy is usually the foundation for trading large-scale price movements in a security. To successfully trade breakouts, you will need to be confident in identifying periods of support and resistance.
Pullback and Retracement Strategy
A pullback in a market is a short dip or slight reversal in an asset’s prevailing price trend. This technique is employed when there is a brief market dip in a longer-term trend. Pullback traders aim to capitalize on these pauses in the market.
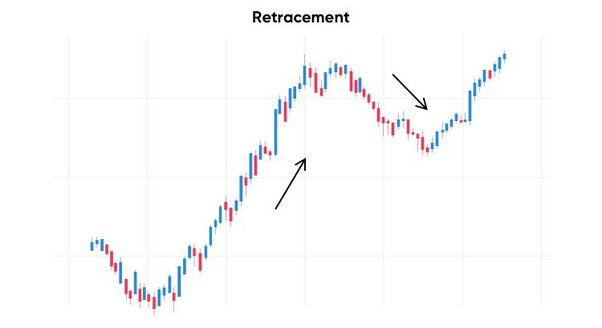
The idea behind this technique is to buy low and sell high before a market briefly dips, and then to buy again at the new low. If executed successfully, a trader can not only profit from a long-term trend but avoid possible market losses by selling high and buying the dips. Of course, this is easier said than done. Some pullback traders use retracement indicators, like the Fibonacci retracement.
One style of trading isn’t better than another; certain styles just suit different people’s personalities and circumstances. Position trading is for people who like to do some research initially, but once a trade is placed, the position requires very little time to monitor or manage. Position trades take place in nearly all markets and can include both buying or taking short positions. Trades are found based on research that indicates a stock could begin to trend, or chart pattern breakouts and technical indicators signaling the potential start of a trend or that a trend is underway.
Thank you for your time.
Anyone interest to joint to positional trading with me click the link 🖇️ Use the link to join the channel on Telegram : 👇🐂
https://rigipay.com/g/NBYYQR13w4
- Live market support
- Personal advice
- Money management
- Tips and tricks
- Help to create a own strategy
- And motivational
- PDF chat
- Secret indicators
- Much more

Thank you for visit my website 🙏 vanakkam 🙏
